SOFF X · AIHujjatingizni AI yaratsinSovg'ani oling
Mahsulot tavsifi
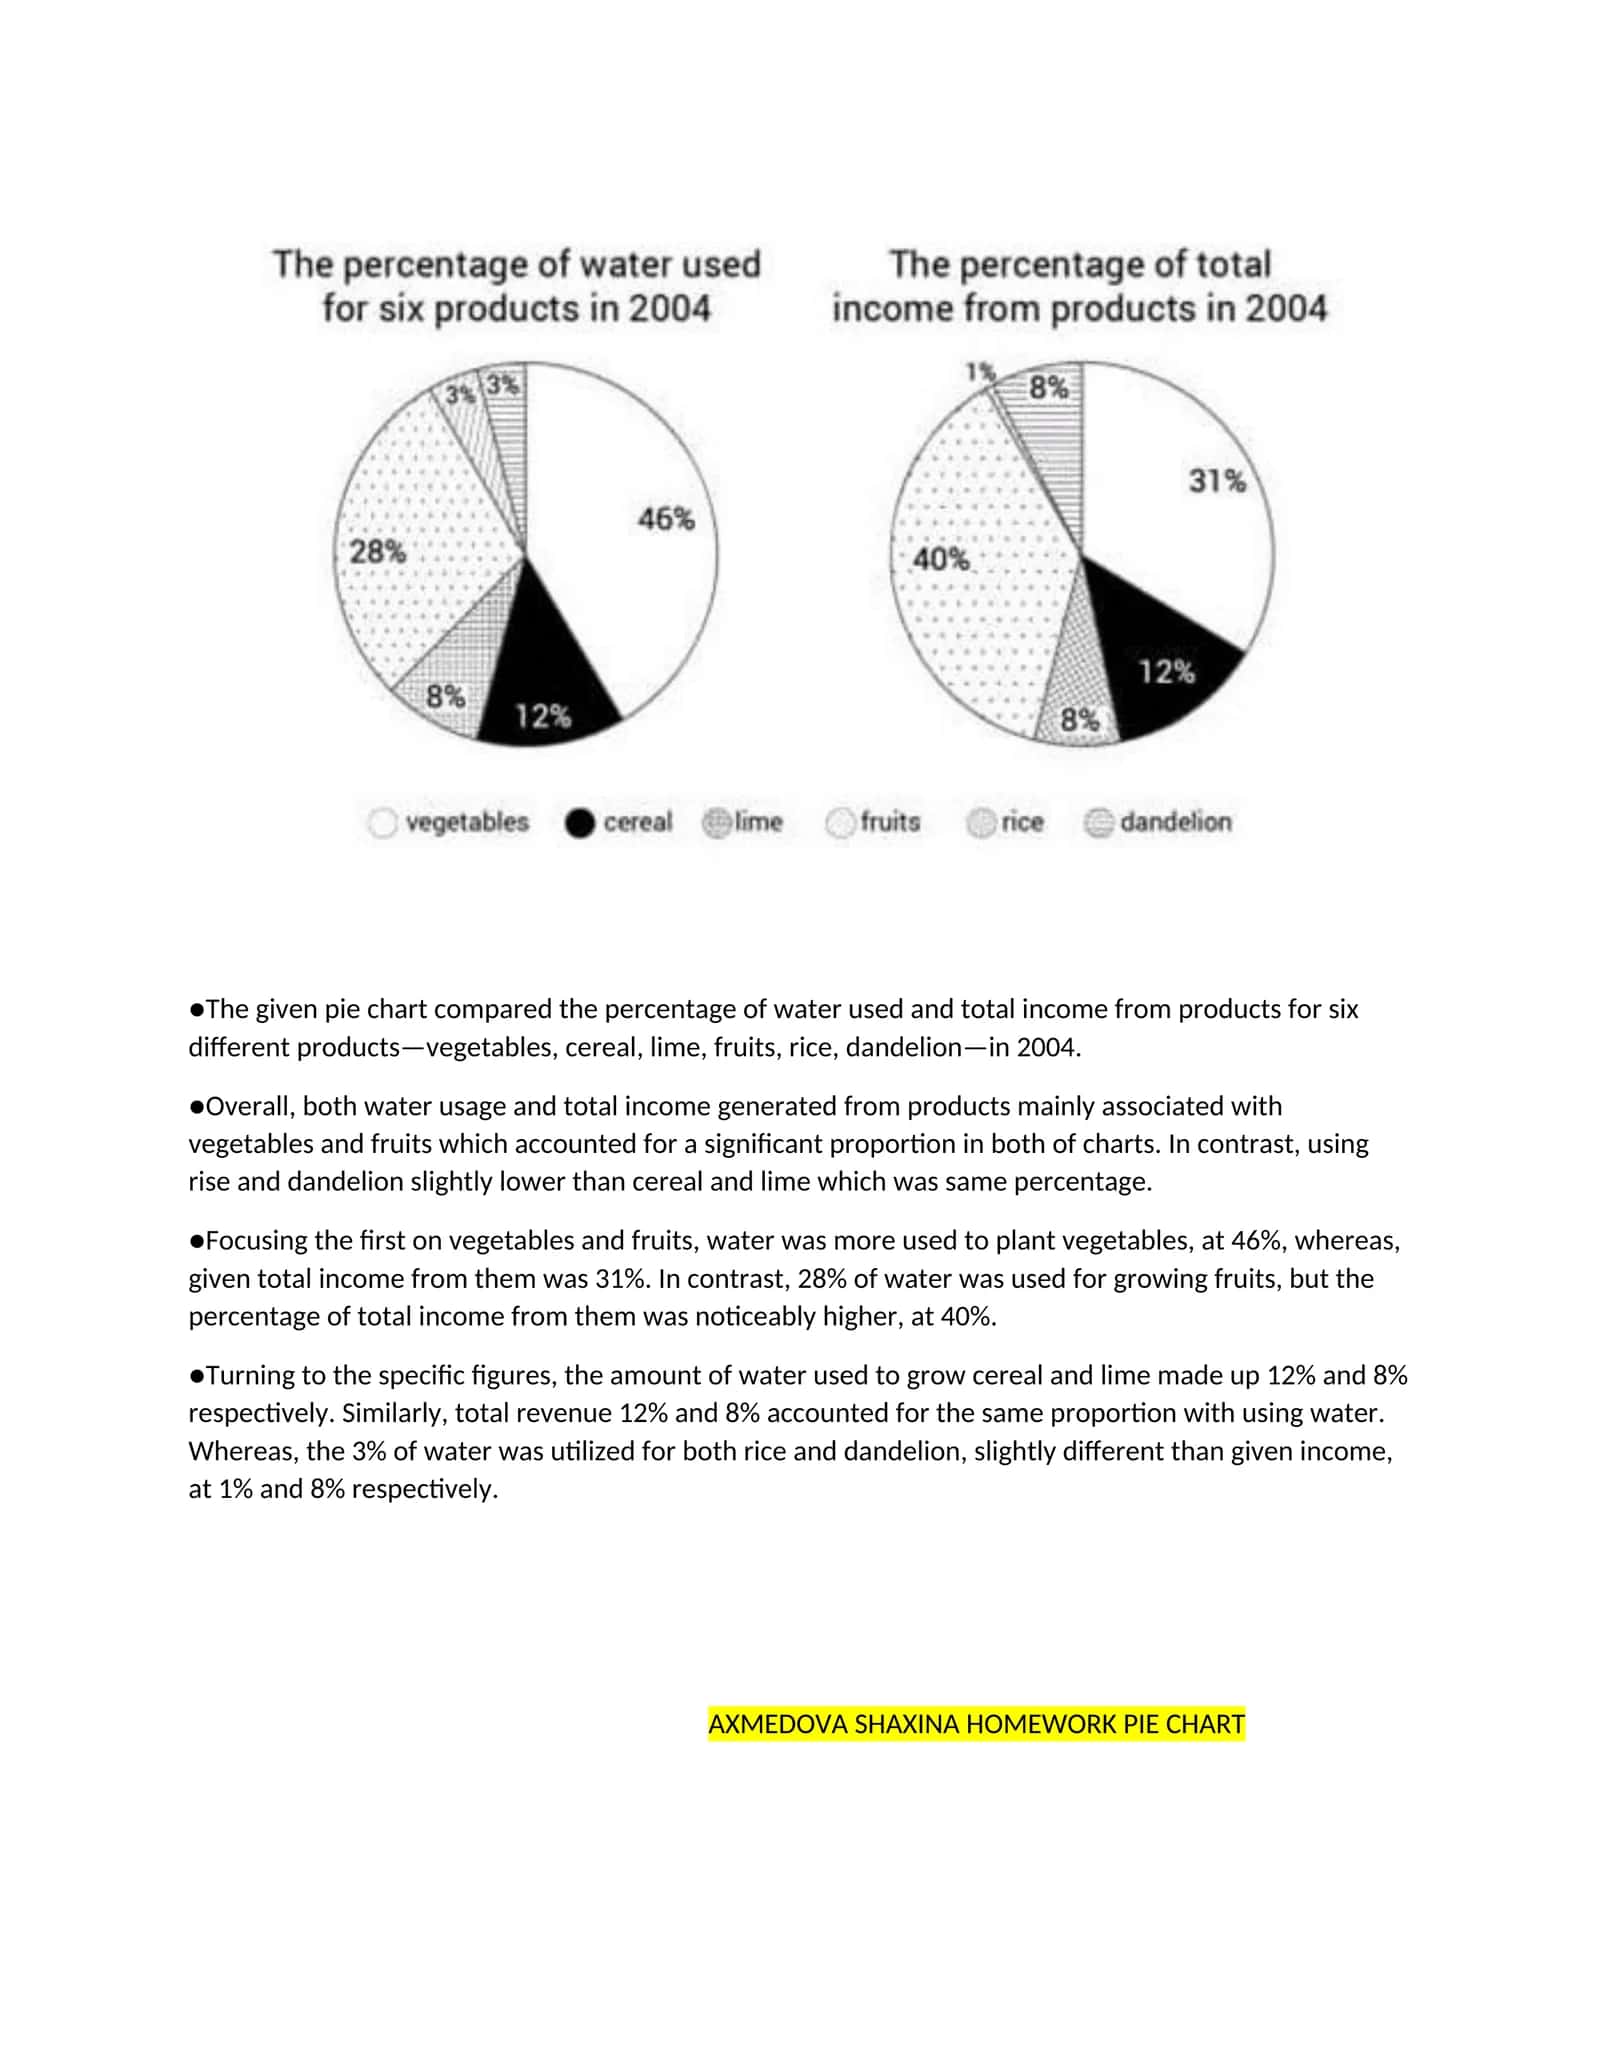
The pie charts show the percentage of water used and income earned from different crops in 2004, highlighting the dominance of vegetables and fruits in both aspects
#income#water consumption#pie charts#fruits#vegetables
Muallif

Shehroz 2303Tasdiqlangan muallif
- Hujjatlari
- 10 349
- Sotilgan
- 1 804